Inventory Expansion and Market Rebalancing
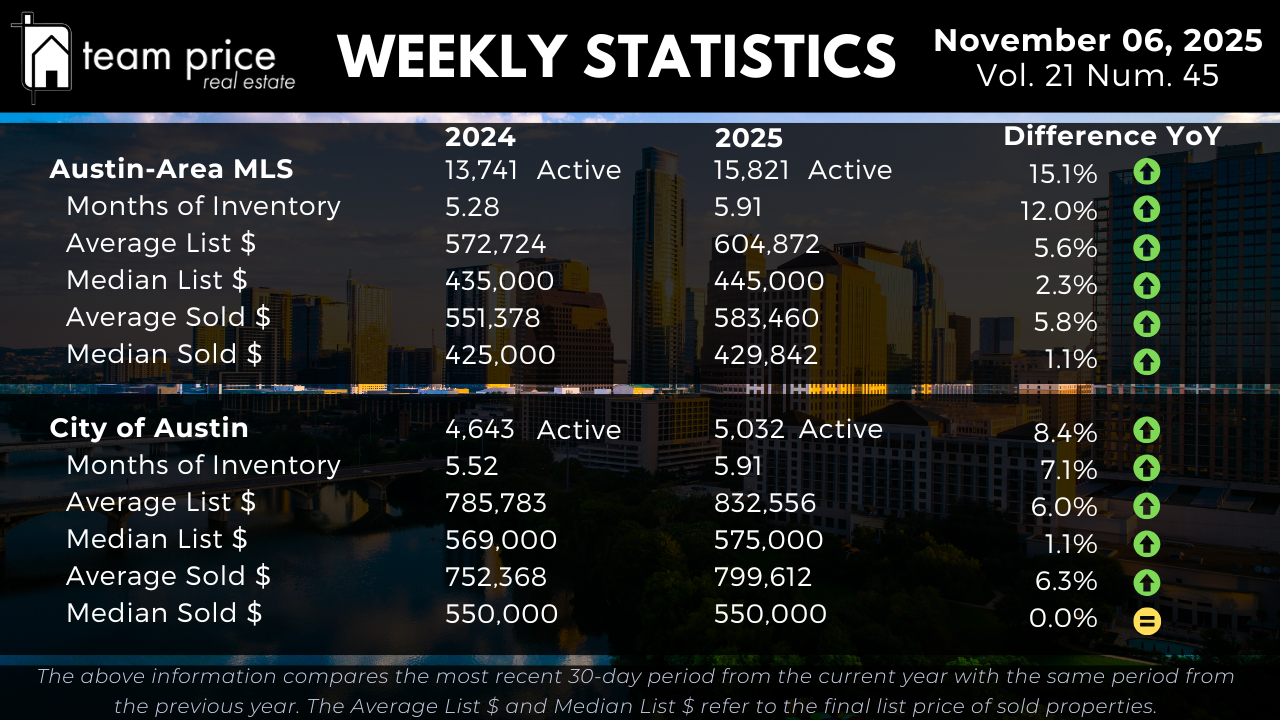
The Austin housing market continues to shift toward a supply-driven environment as inventory expands faster than demand. Across the Austin-Area MLS, active listings climbed 15.1% year over year, increasing from 13,741 in 2024 to 15,821 in 2025. This rise reflects a steady addition of new listings outpacing contract activity as the region enters the final months of the year. Compared with last week’s data, the overall trajectory remains consistent—supply growth continues while absorption levels stay soft, reinforcing the trend toward longer marketing times and increased buyer options.
Months of Inventory has grown from 5.28 to 5.91, an increase of 12% year over year. That translates to roughly 1.1 times the supply available a year ago, confirming that homes are taking longer to sell. Within the City of Austin, active listings are up 8.4%, from 4,643 to 5,032, and Months of Inventory rose 7.1%, from 5.52 to 5.91. Although the city’s inventory gains are more moderate than the regional trend, both levels indicate a firmly balanced-to-buyer-leaning market.
The continued rise in supply is not a short-term fluctuation but part of a durable pattern of normalization. As the fourth quarter progresses, Austin’s housing market remains in a stage of sustained rebalancing, where buyers benefit from increased selection and sellers must compete through realistic pricing, presentation, and strategic timing.
Pricing Trends and Market Direction
Prices across Central Texas have stabilized, showing modest gains concentrated in higher-end segments while median values remain relatively flat. In the Austin-Area MLS, the average list price increased 5.6% year over year to $604,872, while the median list price rose 2.3% to $445,000. These figures suggest that while sellers are listing at slightly higher prices, much of the appreciation is being driven by upper-tier inventory rather than broad-based growth.
On the sold side, the average price rose 5.8% year over year to $583,460, and the median sold price increased 1.1% to $429,842. The modest median gain reflects stability rather than acceleration—typical of a market in equilibrium where buyers and sellers have reached relative pricing alignment. Within the City of Austin, the average sold price climbed 6.3% to $799,612, while the median sold price held steady at $550,000, unchanged from last year. That flat median figure underscores a market that has already completed its major correction cycle and is now operating around its new baseline.
Compared with last week, pricing trends remain directionally stable, with no signs of renewed acceleration or decline. Sellers continue to test higher list prices, but buyer behavior remains disciplined, keeping the overall price structure balanced. This measured dynamic points to a mature market defined by stability rather than volatility.
Negotiation Environment and Buyer Leverage
Negotiation data continues to show clear buyer leverage. As of early November, 67.46% of all sold properties closed below the list price, slightly improved from 70.87% last month. Meanwhile, 18.34% sold exactly at list price (nearly unchanged from 18.08%), and 14.2% sold above list—up from 11.05% last month and 9.97% in November 2024. This small rise in over-ask sales indicates renewed competitiveness in specific price bands where inventory remains tight or homes are well-prepared and accurately priced.
The average sold-to-list price ratio stands at 97.48%, confirming that sellers are conceding around 2.5% to 3% on average. This figure aligns closely with the past several weeks, reinforcing that while negotiation pressure persists, it has stabilized. Homes in premium condition or prime locations are still drawing strong interest, while those priced even slightly above market value are requiring price reductions to secure offers.
This environment rewards precision. Sellers who understand local data and price within market expectations can still sell efficiently, while those who overshoot risk longer timelines and steeper concessions. Buyers, meanwhile, continue to hold the advantage of selection and time, negotiating from a position of strength rarely seen since 2019.
Regional and ZIP Code Performance
At the regional level, the balance between appreciating and declining markets remains remarkably even. Of the 30 tracked cities across Central Texas, 11 (37%) reported month-over-month price increases, 9 (30%) saw declines, and the rest held steady. Year over year, 15 cities (50%) experienced price growth, while the other 15 (50%) declined. Importantly, all 30 cities remain below their 12-month peak values, underscoring how the market’s post-pandemic correction has matured into a stable phase rather than a volatile downturn.
Across the 75 ZIP codes in Central Texas, 28 (37%) showed month-over-month price increases and 27 (36%) showed decreases. On a year-over-year basis, 39 (52%) have posted price gains, while 36 (48%) have declined. Only one ZIP code remains above its 12-month peak, confirming widespread normalization across the region. Week over week, these ratios remain consistent—evidence that Central Texas has entered a balanced holding pattern where local conditions, such as school districts and affordability thresholds, drive most variation.
Prices Relative to Peak Levels
When compared with peak valuations, Austin’s housing market has largely completed its correction phase. Across the Austin-Area MLS, the average sold price remains 8.9% below its May 2022 high, while the median sold price is down 15.9%. Average price per square foot has fallen about 20%, and median price per foot is down a similar 20%. These declines have held steady for several months, suggesting the market has found its durable floor.
Within the City of Austin, the magnitude of the correction is deeper but now stable. The median sold price has dropped 26.5% from its May 2022 peak, while the average sold price is down 16.6%. The average sold price per square foot is 25.6% below its prior high, and the median price per foot has decreased 26.4%. While these figures reflect significant retracement from pandemic-era peaks, they also demonstrate that the steepest portion of the correction occurred long ago. Current pricing stability supports a sustainable equilibrium as Austin adjusts to a higher-rate environment and slower demand cycle.
Market Outlook
As of early November 2025, the Austin housing market is best described as balanced but cooling. Active listings continue to rise at a double-digit annual rate, yet pricing remains firm, illustrating the market’s resilience amid softer demand. The increase in over-ask sales, paired with a stable sold-to-list ratio, signals that well-priced homes are still moving quickly, while others must adjust to align with today’s buyer expectations.
Compared with both last week and last year, the direction is clear: supply is expanding, demand remains consistent but selective, and prices are holding their ground. For buyers, this translates to greater choice and negotiating power. For sellers, success depends on realistic expectations, data-driven pricing, and top-tier presentation. The Austin market has shifted from volatility to balance, setting the foundation for a more predictable and sustainable housing cycle as we move toward 2026.