Austin Housing Market: April 2025 Analysis and Two-Year Trends
The Austin, Texas, residential real estate market has experienced notable shifts over the past two years, with April 2025 marking a significant moment in its trajectory. Data from a comprehensive residential sales report spanning April 2023 to April 2025 reveals key trends in home sales volumes and prices, offering insight into the market’s performance. This article dives into the April 2025 closeout, highlighting the reversal of the year-over-year average sold price increase seen in February and March 2025, alongside a substantial drop in sales volume—the largest year-over-year decline in the two-year period. By examining April 2025 in the context of the broader two-year trends, we uncover the dynamics shaping Austin’s housing market.
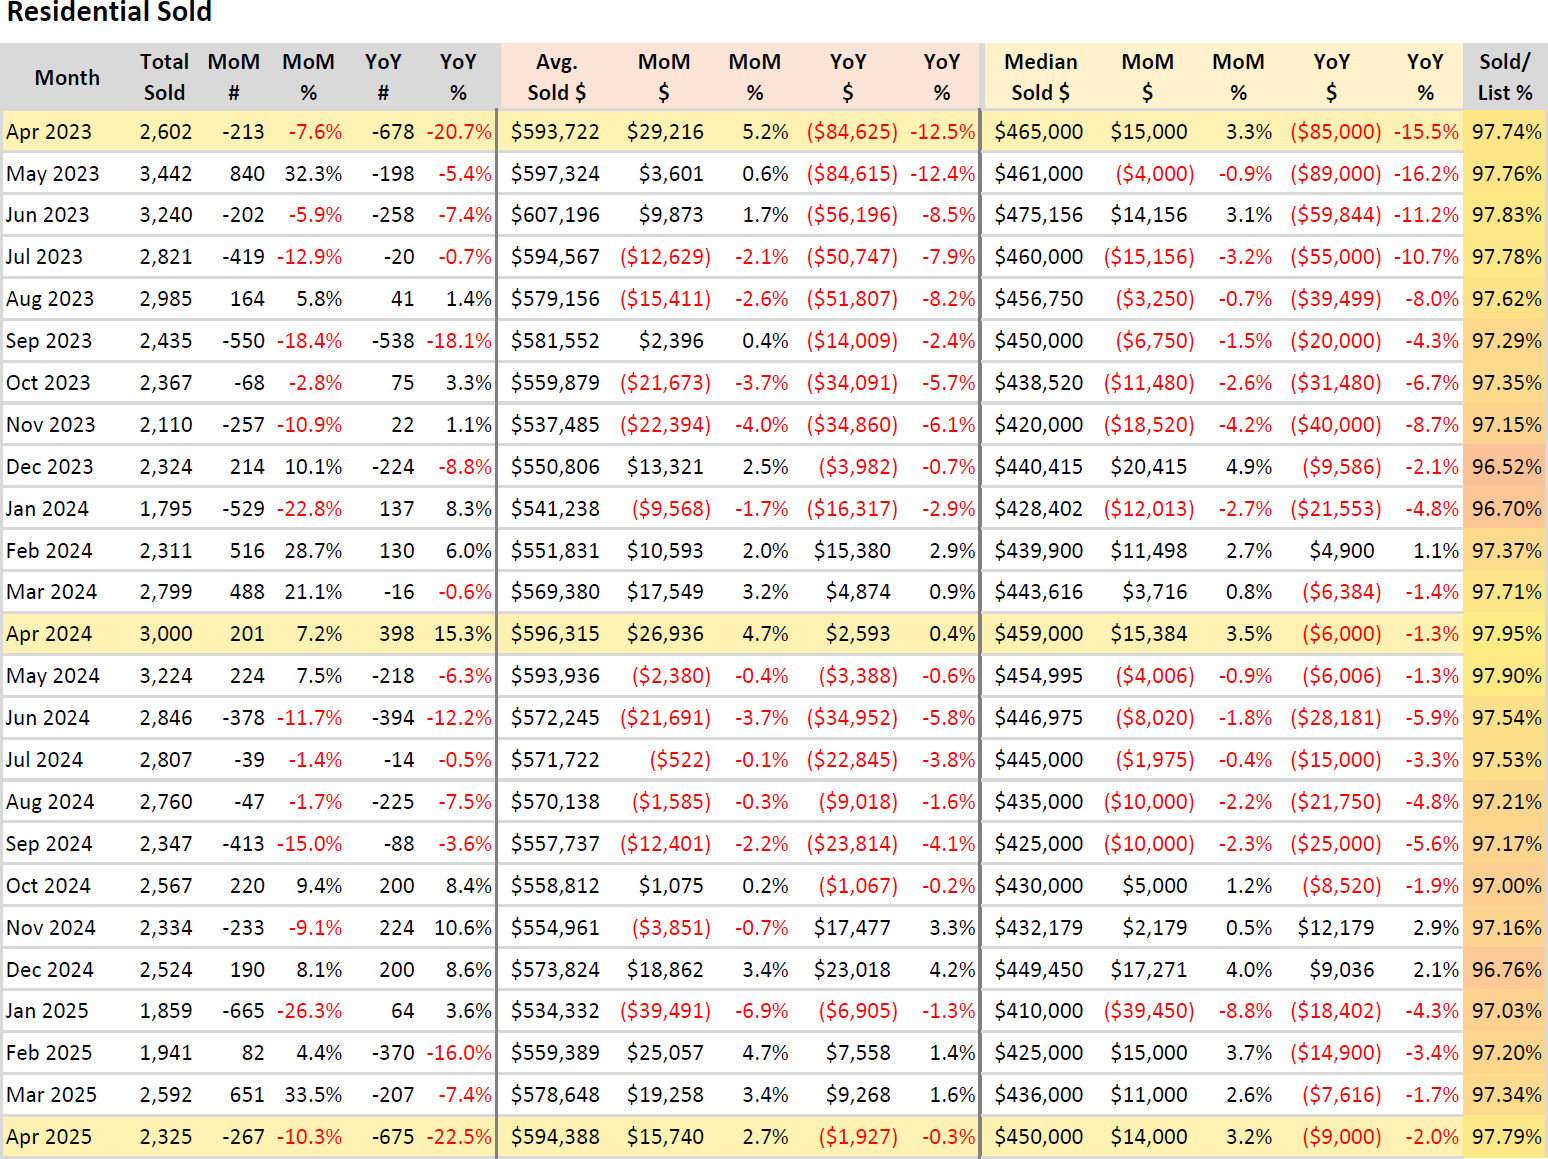
In April 2025, Austin recorded 2,325 homes sold, a 10.3% decrease from March 2025’s 2,592 sales and a striking 22.5% drop from April 2024’s 3,000 sales. This year-over-year decline of 675 homes is the largest in the two-year dataset, surpassing the previous high of a 20.7% drop (678 fewer homes) in April 2023 compared to April 2022. The April 2025 sales figure reflects a continuation of seasonal and cyclical patterns observed over the two years, where spring months like April typically see higher activity but are not immune to broader market pressures. For comparison, April 2023 saw 2,602 homes sold, also down significantly year-over-year, indicating that large April declines are not unprecedented but remain impactful.
The average sold price in April 2025 was $594,388, up 2.7% from March 2025’s $578,648 but down 0.3% from April 2024’s $596,315. This year-over-year decrease of $1,927 marks a reversal from the positive year-over-year price trends in February 2025 (+1.4%, +$7,558) and March 2025 (+0.9%, +$4,874). Over the two-year period, average sold prices have generally trended downward year-over-year, with notable declines in 2023 (e.g., April 2023: -12.5%, -$84,625) and smaller fluctuations in 2024 and 2025. The April 2025 price drop, though modest, signals a shift from the brief upward momentum earlier in 2025, aligning with the broader trend of price stabilization or slight declines.
The median sold price in April 2025 was $450,000, a 3.2% increase from March 2025’s $436,000 but a 2.0% decrease from April 2024’s $459,000. This year-over-year median price drop of $9,000 mirrors the average price trend and contrasts with earlier 2025 months, such as February 2025 (+1.1%, +$4,900) and November 2024 (+2.9%, +$12,179). Over the two years, median prices have consistently declined year-over-year, with larger drops in 2023 (e.g., April 2023: -15.5%, -$85,000) and smaller ones in 2024 and 2025. The April 2025 median price remains below the two-year peak of $475,156 in June 2023, reflecting ongoing affordability challenges.
The sold-to-list price ratio in April 2025 was 97.79%, slightly up from March 2025’s 97.34% and higher than April 2024’s 97.95%. This ratio, which indicates how closely homes sell to their asking price, has remained stable across the two-year period, ranging from 96.52% (December 2023) to 97.95% (April 2024). The April 2025 figure suggests that buyers continue to negotiate slightly below list prices, consistent with the two-year trend of ratios hovering around 97%.
Looking at the two-year context, Austin’s housing market has shown clear seasonal patterns, with sales peaking in spring and summer (e.g., May 2023: 3,442 homes; May 2024: 3,224 homes) and dipping in winter (e.g., January 2024: 1,795 homes; January 2025: 1,859 homes). Year-over-year sales declines were pronounced in 2023, with April 2023’s 20.7% drop and September 2023’s 18.1% decline (538 fewer homes). In 2024, sales showed signs of recovery, with April 2024 posting a 15.3% year-over-year increase (+398 homes). However, April 2025’s 22.5% decline indicates a return to significant contraction, potentially driven by economic factors like interest rates or affordability constraints.
Price trends over the two years further contextualize April 2025’s performance. Average sold prices peaked at $607,196 in June 2023 and hit a low of $534,332 in January 2025, with most months showing year-over-year declines or marginal increases. The largest year-over-year average price drop was in April 2023 (-12.5%, -$84,625), while 2024 and 2025 saw smaller fluctuations, such as April 2024’s 0.4% increase (+$2,593). Median prices followed a similar trajectory, with a high of $475,156 in June 2023 and a low of $420,000 in November 2023. The April 2025 price declines, both average and median, align with this broader trend of softening prices.
The April 2025 sales drop stands out as the most significant in the two-year period, surpassing April 2023’s 20.7% decline. While April 2023’s drop was part of a broader cooling phase, April 2025’s decline follows a mixed 2024 with moments of sales growth (e.g., April 2024: +15.3%) and price stabilization. The reversal of the year-over-year average price increase from February and March 2025 underscores a market facing renewed challenges, potentially signaling caution for buyers and sellers in Austin’s dynamic housing landscape.
FAQ Section
What was the largest year-over-year sales drop in Austin’s housing market from 2023 to 2025?
The largest year-over-year sales drop in Austin’s housing market from April 2023 to April 2025 occurred in April 2025, with a 22.5% decline (675 fewer homes sold) compared to April 2024. This surpassed the previous high of a 20.7% drop (678 fewer homes) in April 2023.
How did Austin’s average home prices change in April 2025 compared to previous months?
In April 2025, the average sold price in Austin was $594,388, a 2.7% increase from March 2025’s $578,648 but a 0.3% decrease from April 2024’s $596,315. This year-over-year decline reversed the positive year-over-year price trends seen in February 2025 (+1.4%) and March 2025 (+0.9%).
What is the sold-to-list price ratio in Austin’s housing market?
The sold-to-list price ratio in Austin’s housing market indicates how closely homes sell to their listing price. In April 2025, it was 97.79%, meaning homes sold for about 97.79% of their asking price. This ratio has remained stable, ranging from 96.52% (December 2023) to 97.95% (April 2024) over the two-year period.